Audience Insights App
The Audience Insights App gives implementation teams a structured way to move from raw audience data to activation decisions. Rather than inspecting audiences in isolation, you use two interconnected surfaces — per-audience summary views and multi-audience Reports — to compare size trends, membership overlap, field composition, and dataflow. This section walks you through both surfaces and shows you how to build reusable comparison reports that turn analysis into concrete actions.
Overview
Learning Objectives
By the end of this section, you will be able to:
- Explain what the Audience Insights App provides and the questions it helps answer
- Navigate the Insights App UI and locate key views
- Identify key audience composition metrics such as demographics, behaviors, and affinities
Overview
In current Lytics implementations, audience insights are delivered through two surfaces:
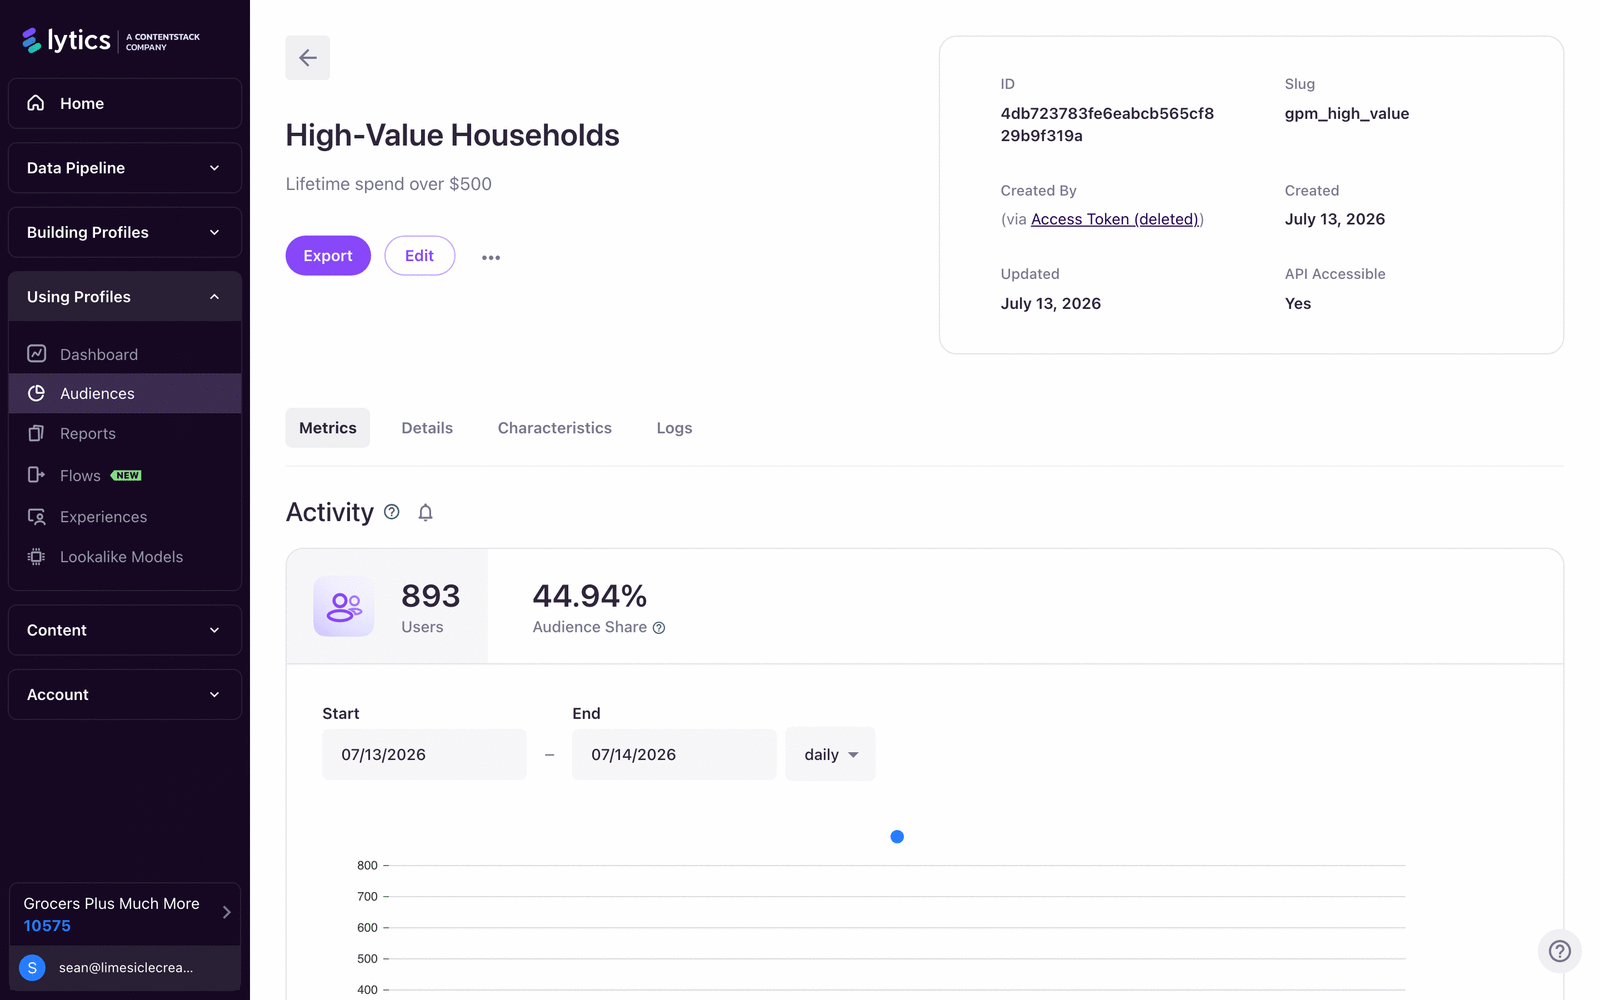
- Audience Summary views (per-audience metrics and characteristics)
- Reports (multi-audience visual analysis using reusable components)
You may also see references to a legacy Insights Drawer experience in older docs. That model focused on generated insight cards; current implementation analysis work is typically done in Reports and audience summary pages.
The audience insights workflow covers comparing audience size, composition, overlap, and dataflow so you can convert findings into activation actions.
From the reporting system and UI source, the core component types are:
- Size: trends and point-in-time audience size
- Composition: field distribution by audience (for example lytics_content, behavioral scores, UTM fields)
- Overlap: Venn-based shared membership analysis
- Dataflow: provider/stream/audience/destination linkage
Key Concepts
- Single-audience vs cross-audience analysis:
- Audience Summary tabs are best for health and lifecycle of one audience.
- Reports are best for comparison between audiences.
- Insights are activation-oriented: overlap intersections can be turned into pre-populated audience definitions.
- Limits to design around:
- Up to 25 reports per account in current UI.
- Up to 20 components per report.
- Overlap components support up to 3 audiences.
- Sharing model: reports can be public to reporting-role users or restricted as private with collaborators.
Step-by-Step
- Start with business questions, not charts (for example: "Which audience is growing fastest?", "Where is overlap causing suppression leakage?").
- Validate audiences are production-ready (definitions, naming, ownership, and enough population).
- Open each audience summary page and review:
- Metrics tab for trend and share,
- Details for dependencies/exports,
- Characteristics for profile composition,
- Logs for recent definition/config changes. - Move to Reports for side-by-side analysis across audiences.
- Build a reusable report that combines size + overlap + composition.
- Convert findings into concrete actions (new audience, exclusion rule, destination export change, or experience targeting update).
Examples
Questions and matching components:
- "Is this audience accelerating?" -> Size component
- "Which topics distinguish audience A vs B?" -> Composition on lytics_content
- "Where are we double-targeting?" -> Overlap component
- "Which pipeline path feeds this audience?" -> Dataflow component
# List reports
curl -s -XGET "https://api.lytics.io/v2/report" \
  -H "Authorization: $LIOKEY"
Diagrams & Screenshots
Summary
Audience insights in Lytics are surfaced through per-audience summary views and the multi-audience Reports workspace. Summary views are best for inspecting the health and lifecycle of a single audience, while Reports provide the cross-audience comparison — size trends, overlap, field composition, and dataflow — needed to make activation decisions. The analysis workflow always starts with a business question and ends with a concrete action: a new audience definition, an exclusion rule update, or a destination export change.
Documentation Links
Implementation Walkthrough
Learning Objectives
By the end of this section, you will be able to:
- Set up the Insights App for a specific audience and configure its parameters
- Interpret insights data to inform marketing and personalization strategy
- Export insights for stakeholder reporting and presentations
Implementation Walkthrough
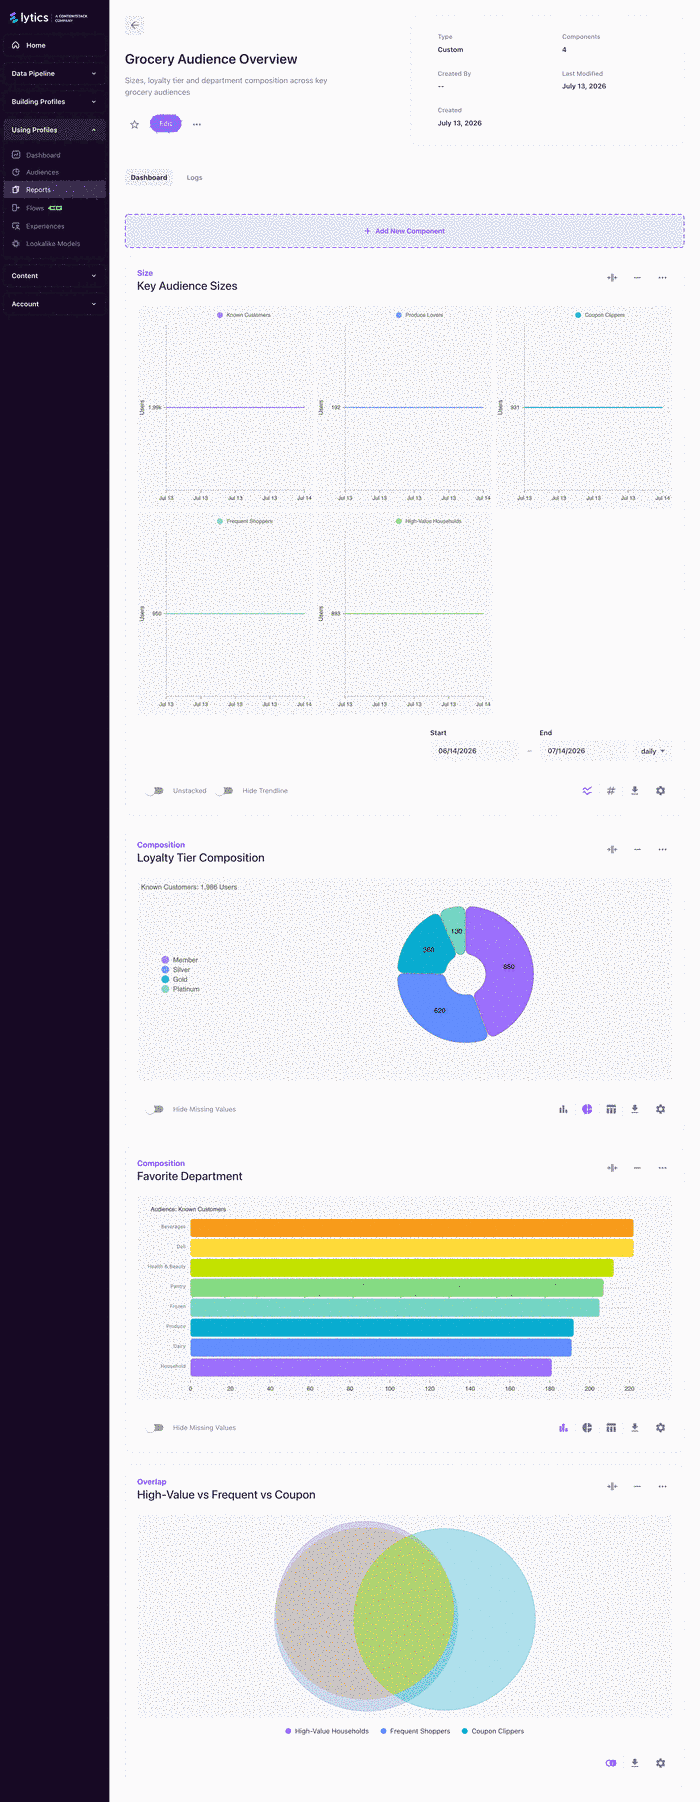
This walkthrough builds a reusable Audience Comparison Report for up to three strategic audiences.
Key Concepts
- Use 2-3 audiences for clean comparisons: this keeps overlap interpretation and stakeholder communication simple.
- Standard comparison stack:
- Size comparison (trend + current value)
- Membership overlap (intersection and exclusivity)
- Interest/behavior composition (why these audiences differ)
- Start with stable fields: use trusted fields (
lytics_content, behavioral score fields, lifecycle attributes) before experimenting with niche fields. - Save interpretation context: meaningful component names and descriptions reduce rework in recurring reviews.
Step-by-Step
- Pick 2-3 audiences with one shared business objective (for example acquisition vs nurture vs retention).
- Confirm each audience has sufficient size and recent activity.
- Go to Reports and click Create New.
- Name the report (for example
Q2_key_audience_comparison) and add a scope description. - Add a Size component for trend and snapshot comparison.
- Add an Overlap component with the same 2-3 audiences (overlap supports max 3).
- Add Composition components for
lytics_contentand selected behavioral score fields. - Add Dataflow if you need stream/provider/destination traceability.
- Rename components to reflect business meaning, then set report access mode (shared or private with collaborators).
- Export component CSVs for stakeholder communication and runbook documentation.
- Convert findings into actions:
- create suppression or opportunity audiences from overlap insights,
- update exports/experiences/flows using composition findings,
- schedule recurring reviews.
Examples
Reference report layout:
1) Audience Membership Comparison (Size)
2) Membership Overlap (Overlap)
3) Interest Comparison (Composition: lytics_content)
4) Frequency Comparison (Composition: score_frequency)
5) Intensity Comparison (Composition: score_intensity)
6) Momentum Comparison (Composition: score_momentum)
# Add a size component to an existing report
curl -s -XPOST "https://api.lytics.io/v2/report/$REPORT_ID/component" \
  -H "Authorization: $LIOKEY" \
  -H "Content-Type: application/json" \
  -d '{
    "name": "Audience Membership Comparison",
    "type": "size",
    "config": {
      "segment_ids": ["aud_1", "aud_2", "aud_3"],
      "type": "sizes",
      "table": "user"
    }
  }'
Interpretation pattern:
- High overlap + similar composition -> consolidate messaging and suppress duplication
- Low overlap + distinct composition -> maintain differentiated channel/creative strategy
- Rising size but falling momentum -> review acquisition quality and nurture timing
Diagrams & Screenshots
Summary
Building a reusable audience comparison report follows a repeatable pattern: select 2-3 strategically related audiences, layer in size, overlap, and composition components, and name everything for business meaning before sharing. The findings from a well-structured report translate directly into activation changes — new suppression rules, updated destination exports, or refined personalization targeting. Recurring reviews against the same report structure let you track whether your interventions are working over time.
Documentation Links
What You've Learned
In this section you worked through both surfaces of Lytics audience analysis: the per-audience summary view for inspecting individual audience health and the Reports workspace for multi-audience comparison. You learned how to frame business questions as component choices, validate audiences before analysis, and build a structured comparison report that covers size, overlap, composition, and dataflow. The walkthrough showed you how to name and share reports effectively and how to convert every insight into a downstream activation action.
Key Terms
📘 Audience Insights workflow — The implementation workflow for comparing audience size, composition, overlap, and dataflow so you can convert findings into activation actions.
📘 Audience Summary view — A per-audience page in the Lytics UI that surfaces metrics, characteristics, dependencies, exports, and change logs for a single audience.
📘 Report — A saved dashboard object containing one or more configurable components (
size,composition,overlap,dataflow) used for cross-audience analysis.📘 Composition component — A report component that shows the distribution of a selected profile field across one or more audiences, useful for understanding behavioral and interest differences between segments.
📘 Overlap component — A report component that renders Venn-style intersection and exclusion analysis for up to three audiences, used to identify double-targeting or suppression opportunities.
📘 Dataflow component — A report component that maps provider/stream/audience/destination relationships, used for integration path traceability and pipeline troubleshooting.
