

.svg?format=pjpg&auto=webp)
.svg?format=pjpg&auto=webp)
.png?format=pjpg&auto=webp)


.png?format=pjpg&auto=webp)
View Execution Log of Automations
The Execution Log section in Automate helps you monitor the status of your Automations. When you execute an automation, the execution status will be categorized under one of the following statuses:
- Running: The execution is currently in progress.
- Partially Executed: The execution completed some steps but not all.
- Success: The execution completed successfully.
- Failed: The execution did not complete successfully.
- Queued: When multiple executions are present in a queue waiting for their execution. This status is visible only when the throttle automation toggle is enabled for the automation.
- Rejected: When the execution exceeds the allocated time, then the execution goes in the Rejected state.
- Paused: The execution will be paused when we configure Pause action in our automation.
- Pending: When the execution is yet to be picked up for processing and when the throttle automation toggle is disabled for the automation.
To access Execution Log, log into your Contentstack account and perform the following steps:
- Click the Automate icon from the left-hand side primary navigation panel.
- On the Projects landing page, select the project for which you want to view the execution log.
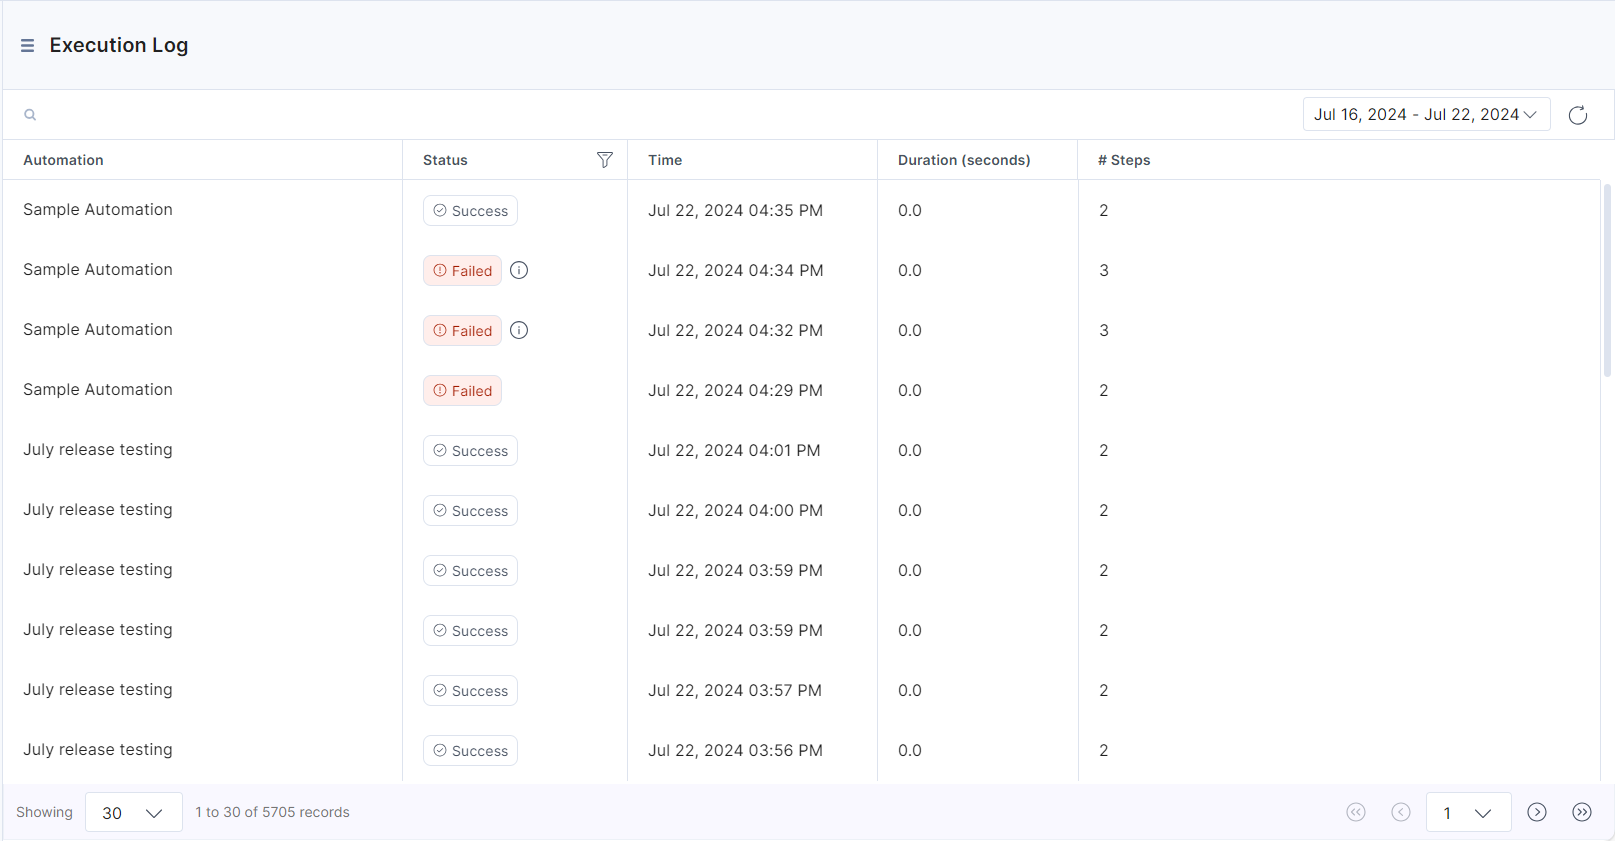
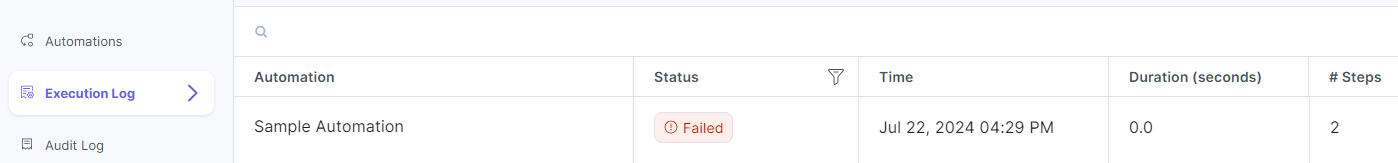
- From the left navigation panel, click Execution Log. You will see the details of the execution of the workflow. It shows the following:
- Automation name.
- Time (date, time).
- Status (with execution statuses as discussed above).
- Duration (in seconds).
- The number of steps, i.e., the number of connectors configured and executed in the automation.
To view specific logs, you can filter the execution log by date as shown below:
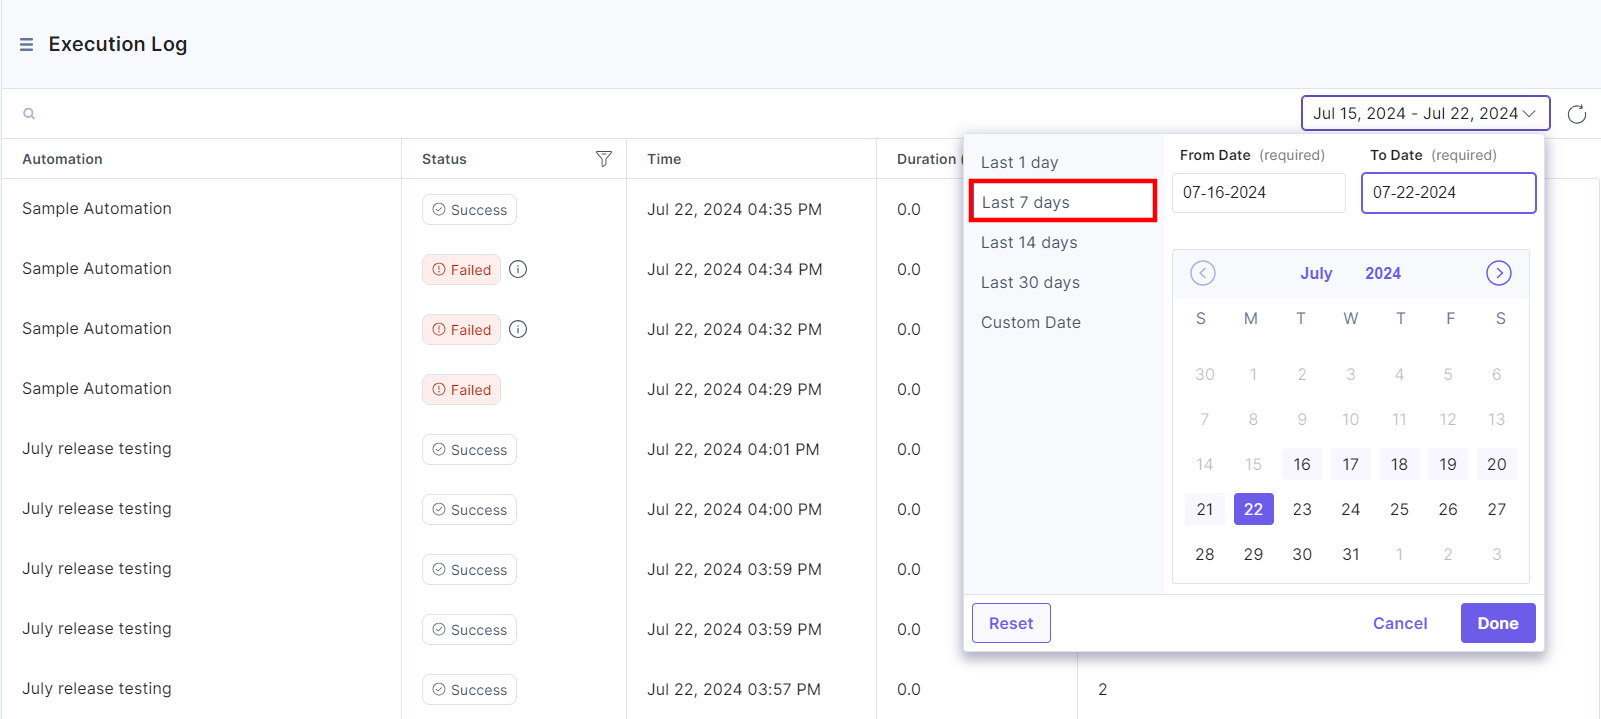
Note: To view the logs, you must execute an automation.
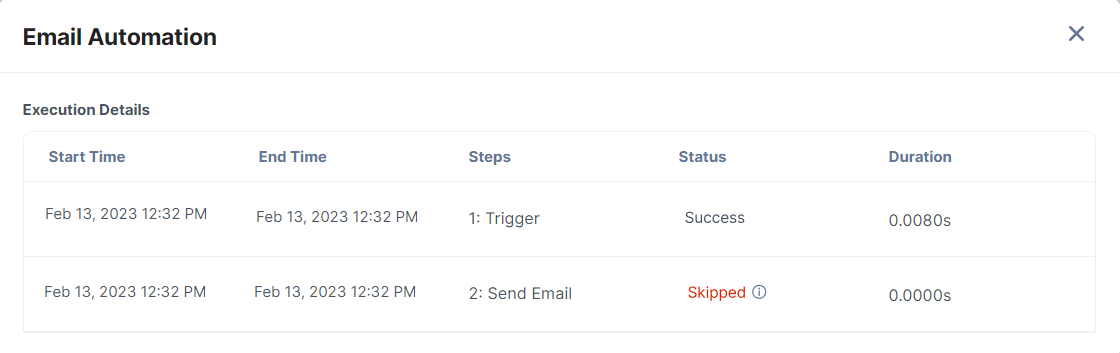
To view more details of a particular execution, click a specific log. You will see a time-wise distribution of each step.
- If any execution has a Failed status, you would be able to see the details here.
- If any execution has a Partially Executed status, you will be able to see the details of the Skipped step in the Execution Details pop-up.
Retry Execution for Failed Automation
Certain API errors, or missing configuration of an action step in Automate can cause the entire automation to fail. If you encounter this issue, you can use the Retry Execution feature to troubleshoot the automation.
With this feature, you can retry the execution up to 2 times using the following steps:
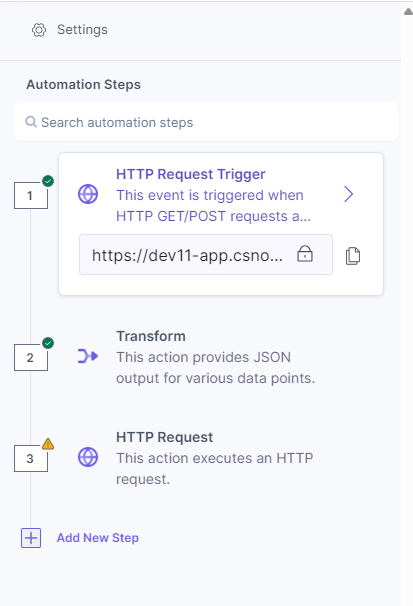
- Suppose you have an automation with an unconfigured action step, as shown below:
- Activate the automation and test the configured trigger. For example, test the HTTP trigger.
- Go to the Execution Log section. The status of the automation will show as Failed. An Info icon appears beside the Failed status. Click it to open a pop-up.
- Click the Retry Execution button to retry the execution.
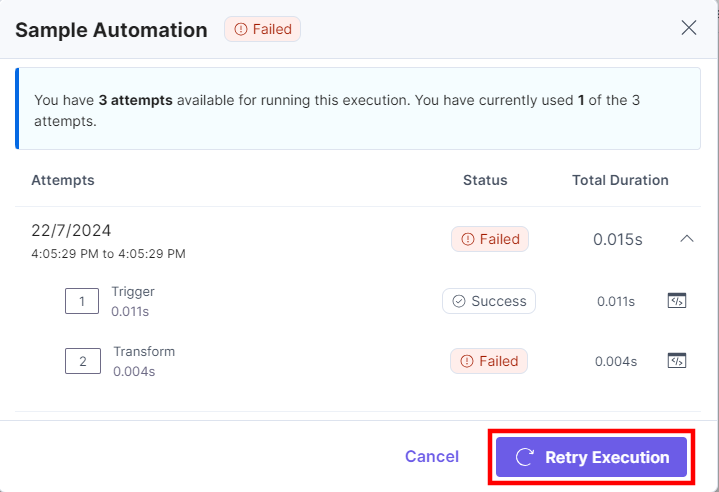
Note: The first attempt occurs when you activate and execute the automation. In the Retry Execution pop-up, you can retry the execution up to 2 more times.
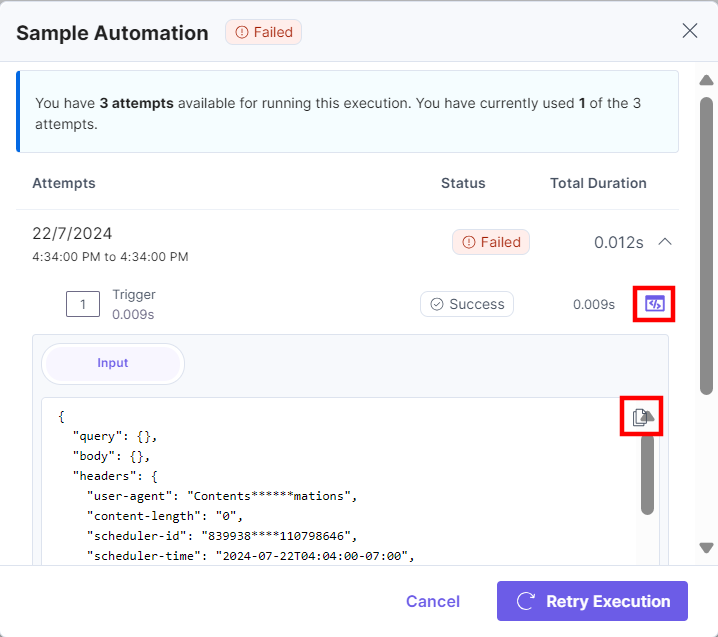
- Click the Code icon for the failed step to view the Input/Output payload for the action step. For a trigger, you can specifically view the Input option.
Additionally, you can click the Copy icon to copy and debug the code.
Let’s explore a few use cases to understand the Retry Execution feature better.
Use Case 1
If an automation fails in the first attempt due to any technical issue or server error at the exact time of execution, follow these steps:
- In the Failed Execution, click the Retry Execution button and close the window.
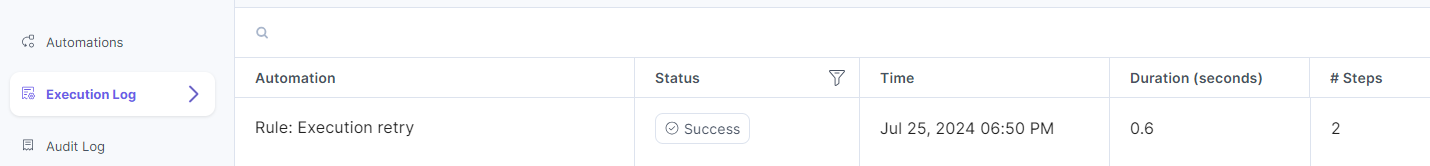
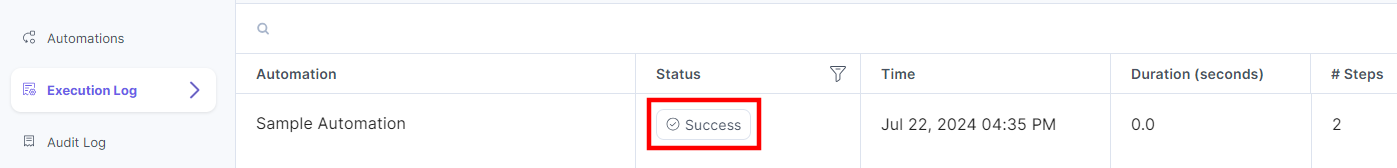
- In the Execution Log, you will see a Success status for that execution.
Use Case 2
If an automation fails even after retrying, follow these steps:
- Go to the automation and deactivate it.
- Reconfigure the failing step.
- Once successful, activate the automation again.
- Return to Execution Log and click the failed execution.
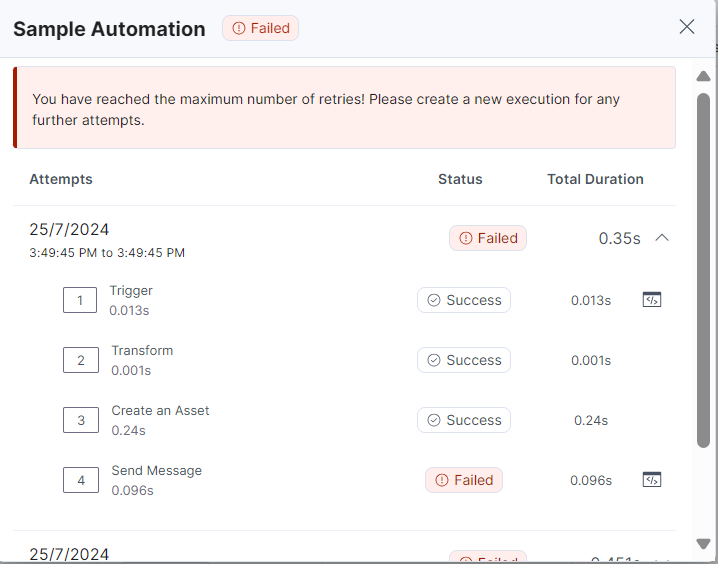
If the action step was previously configured with invalid or incorrect values, the execution will show a Failed status.
In the Retry Execution pop-up, you can retry the execution up to 2 times. You can debug the code by checking the payload. If the error is due to a third-party API or within Automate, please contact our support team for assistance.
Use Case 3
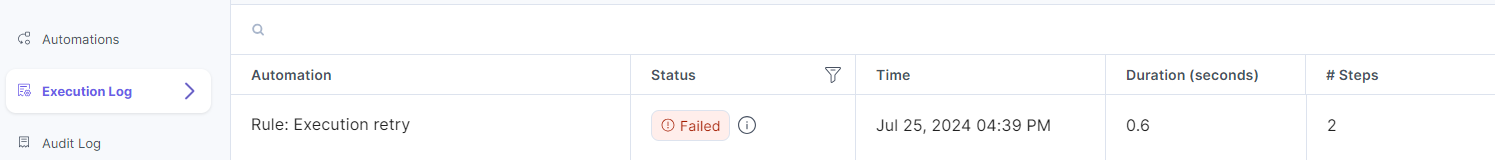
If an automation fails and you reconfigure a new trigger, retrying the same execution will result in an error message:
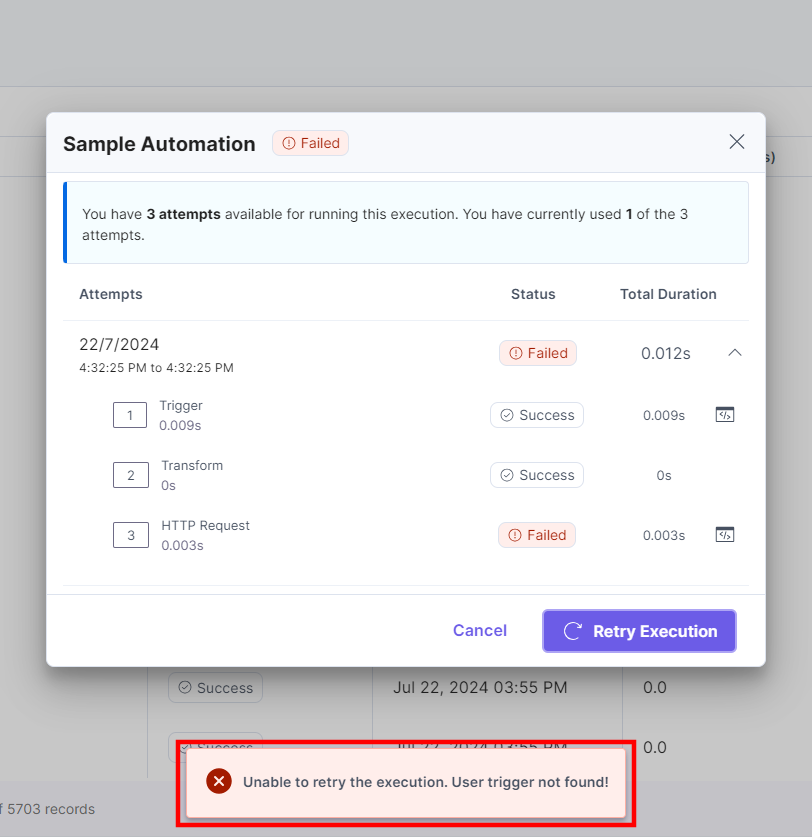
This happens because the execution still has the payload data for the previously configured trigger. You must initiate a new execution to validate the changes.
Use Case 4
If an automation runs successfully on the first attempt, you will see a success message as shown below:
Limitations
- If an automation has a Response connector, you will not be able to retry the execution for that automation.
- The Info icon disappears once the retry limit is exceeded. You must start a new execution.
More articles in "More about Automate"
