Intro to Reports
Learn about Lytics' New Reporting capabilities.
Lytics Reports
Introduction
In this training guide, we will introduce you to Lytics Reports and how to leverage Reports in your marketing efforts.
Lytics Reports help users understand, analyze, and interpret their data and audiences. Reports can be used in a variety of ways, including:
- Comparing audiences (ie for A/B testing purposes)
- Validating newly ingested data
- Understand the attributes of user profiles
With all the powerful data captured by our integrations and tags, Reports help you make sense of the data right in the Lytics app.
For more information about Reports, check out the product documentation here
Objectives and Key Terms
By completing this training, you will learn how to create, edit, and manage Reports!
Key Terms
Here are some of the key terms that you will come across:
- Report: a powerful dashboarding tool to visualize and gain critical insights from your customer data. Reports can consist of 1 or many Components.
- Component: a method of graphically visualizing data. There are currently 2 types of Components: Size and Composition.
- Field: a user-profile field
- Sub-Field: a value of a Field (only applicable for map and set Fields).
- Composition Component: a chart that displays the distribution of values for a field across your audience in various ways, including as a Bar, Pie, and Line chart.
- Size Component: display the sizes of one or more Audiences as a time-series chart or numeric value
Which of the following are valid Components?
A. Audience Component
B. Composition Component
C. Campaign/Journey Component
D. Size Component
E. Marketing Component
Answer: B, D
When should you use a Composition Component?
A. To plot the sizes of one or more Audiences as a time-series chart
B. To display the distribution of values for a user-profile Field
C. To compose music
Answer: B
When should you use a Size Component?
A. To plot the sizes of one or more Audiences as a time-series chart
B. To display the distribution of values for a user-profile field
C. If you want to find out your T-shirt size
Answer: A
Creating, Editing & Managing Reports
Creating Reports
To create a new Report, first, navigate to the Reports section in the left-hand-side navigation bar: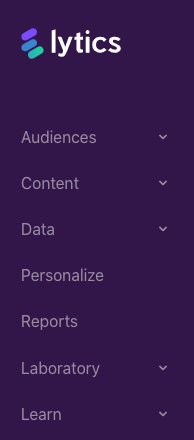
Next, click on the Create New button at the top of the page. You will then be directed to the Report wizard, where you will select Custom Template and then name your Report and provide an optional description.
And that's it! You've now created your first Report!
For more information, check out the product documentation here
Creating / Editing Components
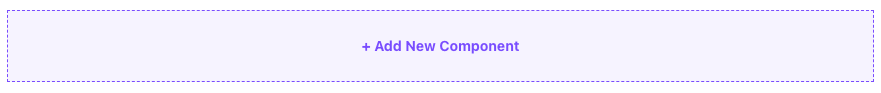
To create a new Component, click on the Add New Component button on your Report page.
Next, click on the select the component that you would like to create:
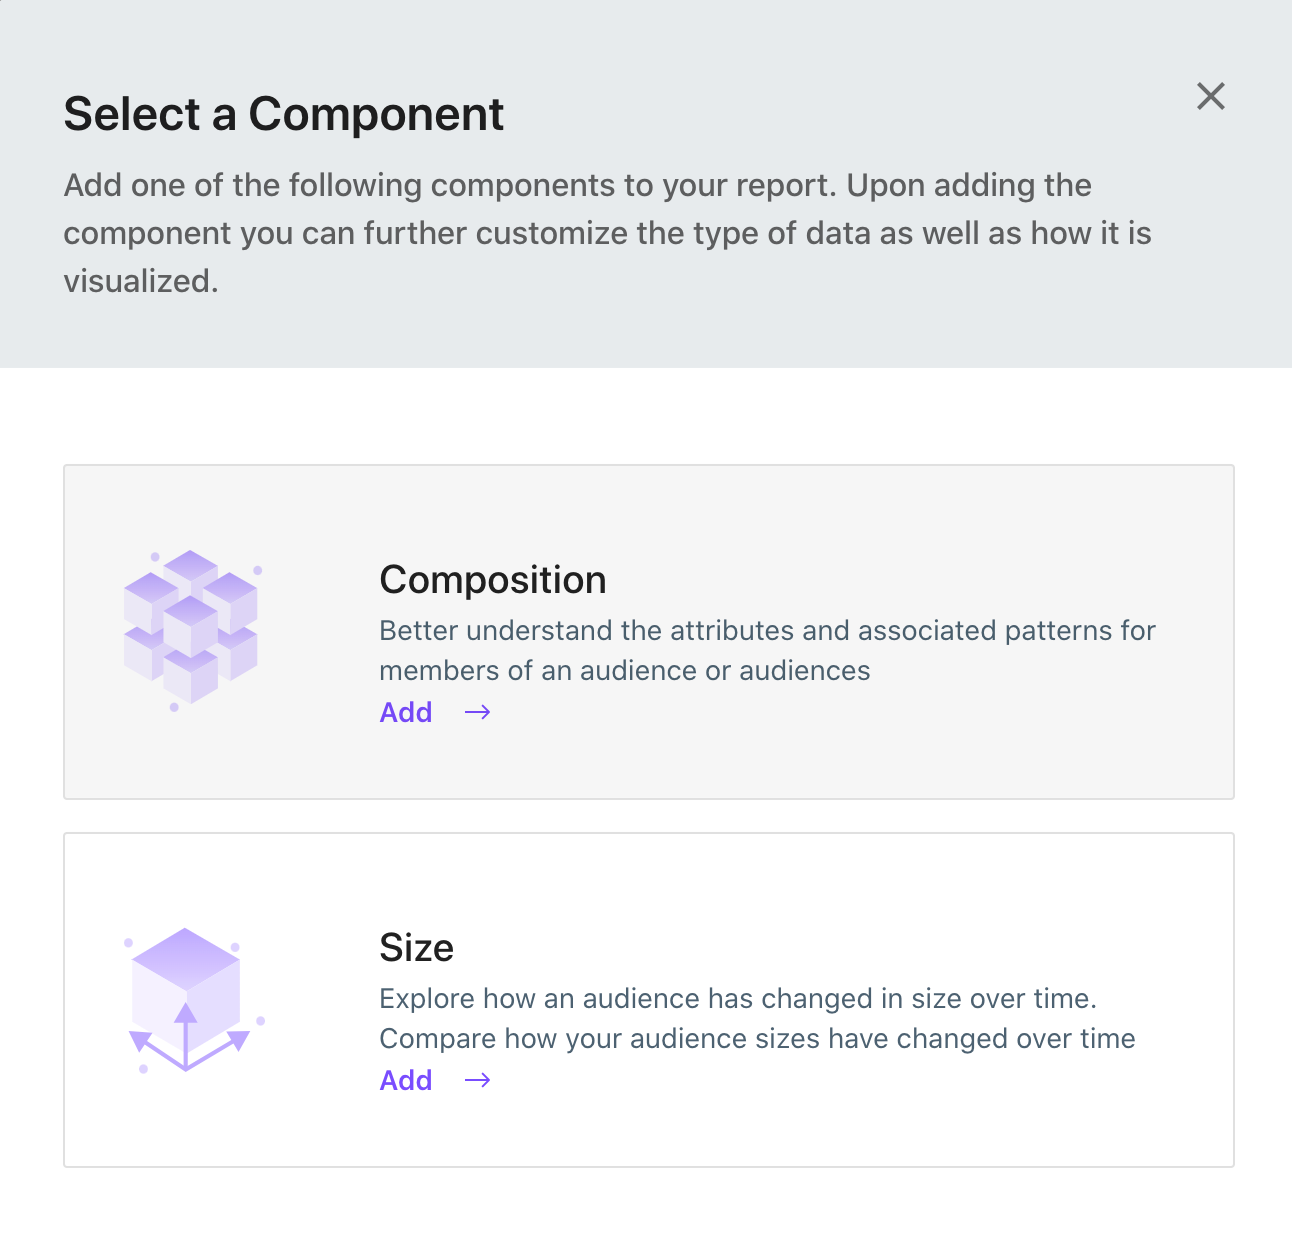
To create a Composition component, click on the Composition button from the Select a Component menu.
In the configuration menu, complete the following fields:
- Name
- Description (optional)
- Audiences
- Field
- SubField (this option will only appear when the Field selected is a set or map)
Depending on the field type of the field you select, Lytics provides a variety of ways to visualize the data. Using the options in the bottom right corner of the component, you can opt to display the data in a Bar Chart, Line Chart, Pie Chart, Table, or Stats view (for numeric fields). By default it will display as a line chart when first created.
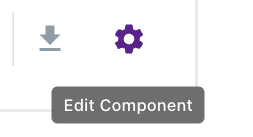
If you would like to edit the Composition component, click on the Edit Component button (the gear icon in the bottom right corner of the component).
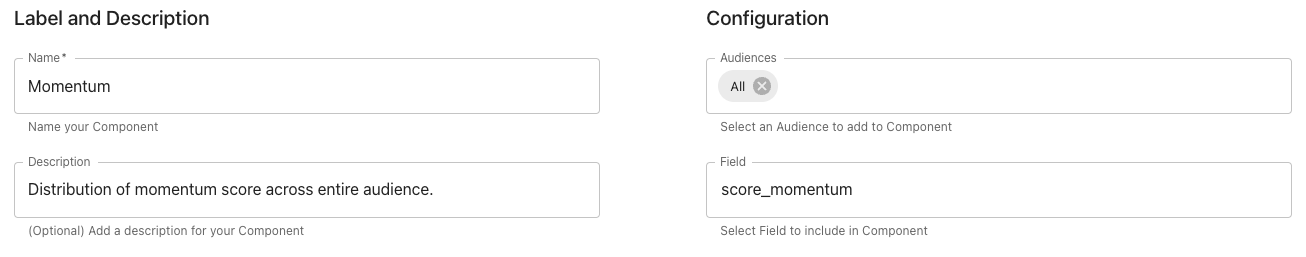
Try creating your own Composition component:
For simplicity, select the "All" Audience, and the "Score Momentum" Field, provide a name and description for your component, and click on the Save button. Once the page reloads, you should see a Line chart that plots of the distribution of the "Score Momentum" field.
Check out the product docs for more information about Composition components.
To create your a Size component, click on the Size button from the Select a Component menu.
In the configuration menu, complete the following fields:
- Name
- Description (optional)
- Audiences (you can select multiple audiences to allow you to compare them to one another)
After selecting and saving the Audience(s), the Size component will display a time-series chart of the Audience size(s). In the bottom right corner of the component, you also will have the option of displaying just the current audience totals. If you would like to see both audiences in a single chart, toggle the Unstacked switch in the bottom left corner of the component.
If you would like to edit the Size component, click on the Edit Component button (the gear icon in the bottom right corner of the component).
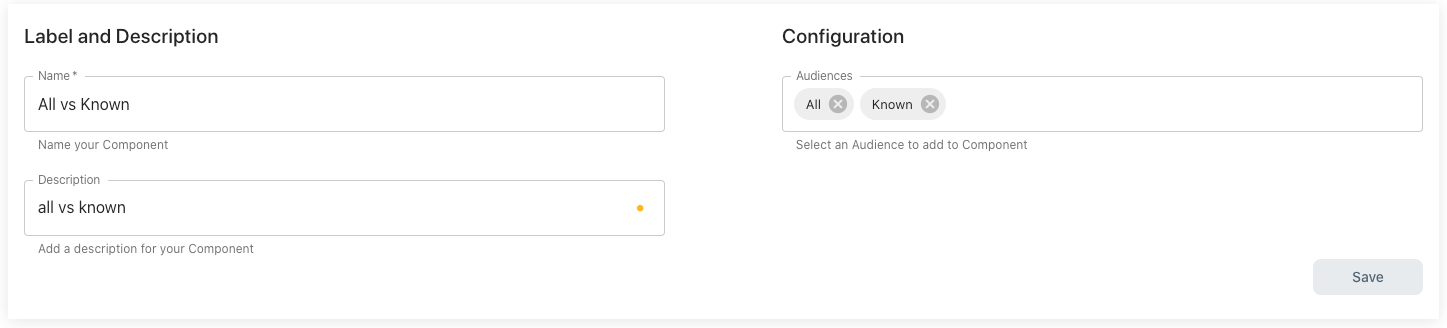
Try creating your own Size component:
For simplicity, select the "All" and "Email Capture Status: Known Email" out of the box audiences. Provide a name and description for your component, and click on the Save button. Once the page reloads, you should see a time-series chart that displays the audience sizes for the "All" and "Email Capture Status: Known Email" audiences.
Check out the product docs for more information about Size components.
Managing Reports
Editing Reports
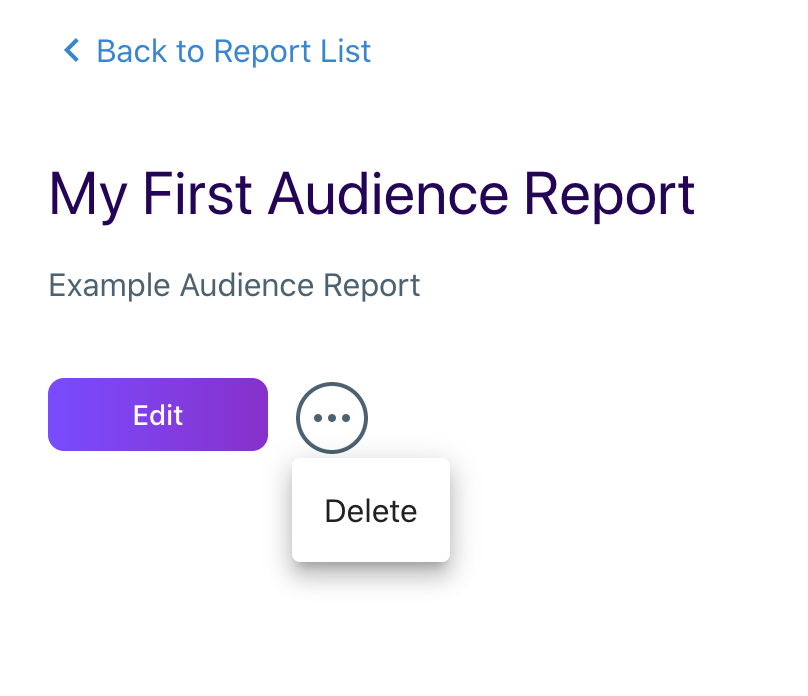
To rename the Report name or description, click on the "Edit" button at the top of the Report page.
Downloading Reports
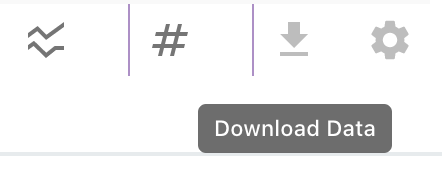
Each component in Lytics provides the option to download the associated data in a CSV format. The Download icon is located in the bottom right of each component.
For more information about managing your reports, check out the product docs
Example Reports
When to use Reports
When you first start using Lytics Reports, you may struggle with identifying the best Audiences and Fields to use. To get you started, below is a list of potential components to use, and why you may want to use them.
Campaign Analytics:
- Size component with the audiences used in the campaign to compare how each audience in the campaign grows and shrinks over time
- Composition component with the audiences used in the campaign, and the out-of-the-box UTM fields (ex: utm_terms, utm_mediums, utm_sources, etc).
Data Science
- Composition component for each of the 9 behavioral scores
Composition component for Topic Affinity. Select the lytics_content field, and select a topic as a Sub-Field to compare the affinity for a specific topic across audiences. - Composition component for Lookalike Model Predictions. Select the segmentml_predictions field and select a model as a Sub-Field to compare the distributions of predictions for a model across audiences.
Demographic
- Composition component for country, city, and state fields to compare the location of users across audiences.
- Composition component for gender, age, and other demographic fields.
Custom Data
- Composition component for any custom field within your account.
Reports Playbook
For walkthroughs around how to create some additional Reports, download the below playbook. This playbook covers the following examples:
- Web data available when using our Javascript tag
- Audience data from A/B testing
- Shopify data available when using our Shopify integration
- Lookalike model data
Here's the Reporting Playbook.